This document is for offering detailed information regarding the filter you can use for your dashboard in Analytics Framework, including how to configure them and how to choose the right type of filter for your need, with use cases.
Creating a Filter
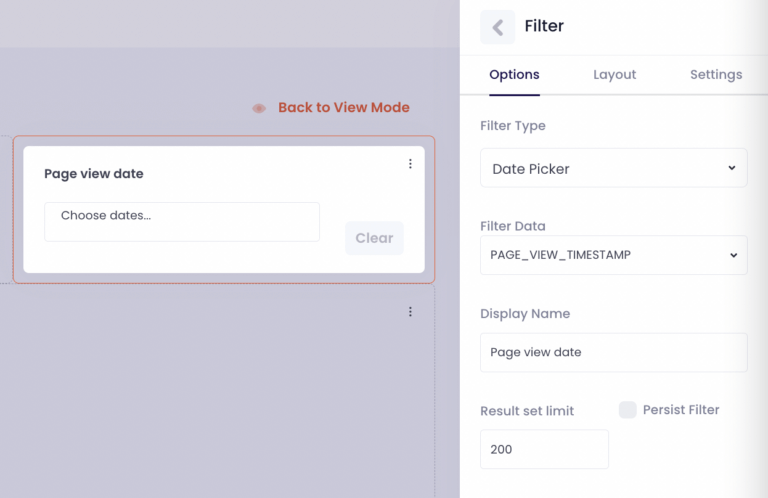
You are able to insert a filter control to your dashboard with a simple drag and drop. Click it once and a panel will appear in the right sidebar. In the ‘Filter Data’ drop-down menu, you choose which attribute you would like to filter on. This will automatically become Display Name, the title of your filter. You also are able to edit Display Name.
By checking the ‘Persist Filter’ box, the filter will persist continuously so the data filtered still remain even if you leave the dashboard and come back. If you want the dashboard to be refreshed and clear filtering once leaving the dashboard, just remain the box empty. The dashboard will automatically revert back to the original charts when you leave it and come back for it.
Filter Type
Multi-choice picker
This filter type allows you to select more than one condition in order to filter your data.
e.g. See the data of supporters only from Stockholm and Paris
Single-choice picker
This filter type allows you to select only one condition in order to filter your data.
e.g. See the data of supporters only whose gender is Female or Male
Date picker
This filter type allows you to filter your data within a specific time period.
e.g. See the data of supporters only who joined the membership last year
Number range
This filter type allows you to filter your data within a specific number range.
E.g. See the data of supporters only whose purchase amounts are from 100 to 200
NOTE: For every filter type, you can only choose one column for Filter Data. The dropdown list of columns you can choose for Filter Data is changing according to the filter type. For example, If the filter type is a Date picker, the dropdown only shows date format columns.