“Numbers speak for themselves” – you heard this saying right? This is something that well meaning people say to convince others on the importance of numbers, that is, data. You have probably also heard the quote, “let the data speak for itself”. Although I am sure that these can be intepreted in a way that is not misleading, most often, these sayings are often used in misleading ways. Implying that numbers and data speak for themselves. And that you do not need to do anything extra with it. This is absolutely not the way to go at all. That is why today we are discussing data storytelling.
Data storytelling gives sports organizations an opportunity to make higher revenue – helping them meet and exceed their expectations.
So we will discuss:

What data storytelling is

Why it's important

And how you can use data storytelling to increase your revenue
Before we dive right in...
Subscribe to our blog today to ensure that you never miss valuable posts such as this one. We are passionate about helping sports organizations deliver a world-class fan experience, because better fan experience means better business. So why not use this opportunity to the fullest?

The power of stories

“Stories are a communal currency of humanity.”
– Tahir Shah | Author, Journalist and Documentary maker
Human beings relate in stories. From generations of old who told folk tales to children around a fire under starry lights to the current generation that create TikTok videos for the whole internet to see – stories are a human currency. In both instances, people use storytelling to communicate specific messages. Instead of just communicating that message directly, they use narratives and visuals to evoke deeper emotions in the listener. Thus creating a lasting and impactful memory in the listners’ minds. So indeed, “storytelling is among the oldest forms of communication.

“Storytelling is the commonality of all human beings, in all places, in all times.”
– Rives Collins | Chair of the Department of Theatre at Northwestern University.
What is data storytelling?
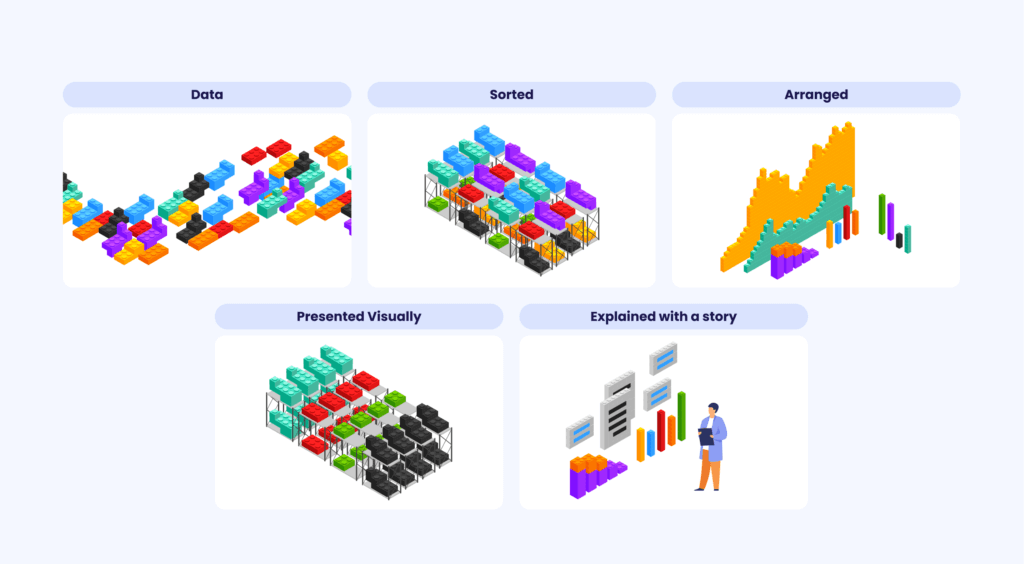
Data storytelling is the ability to effectively communicate insights from a dataset using narratives and visualizations. So the main purpose of data storytelling is to communicate insights, derived from data, effectively. Let’s break this down a little bit more. There are three components of data storytelling and they are data, narrative and visualization.
Data
Data forms the foundation of your story. So this data should be reliable because otherwise the story that you tell with that data will be false. And just like a good story is a powerful tool for creating higher revenue, a false story can just be as powerful in producing the opposite results. So ensure that your data is reliable, complete, unified and always up to date. Furthermore, since we established right at the beginning that data does not speak for itself, this data has to be analyzed. You do this to get actionable insights. These insights are what you build your story on. So your data collection and data analytics should be impeccable.
That is why I always recommend that sports organization use a customer data platform (CDP) for both their data collection and data analytics. Not only that, but with the same platform, you can also act straight away on whatever insights you get from your data and data analysis.
Narrative
Once again, the narrative you tell depends on the insights you gain from your data analysis. So, in a nutshell, you use your insights to create a rich storyline with a context plus the message you wish to tell. Equally as important, is the action you want your audience to take, what is known as a call-to-action (CTA) in marketing. The narrative can help you evoke deeper emotions and connections with your audience members.
Visualizations
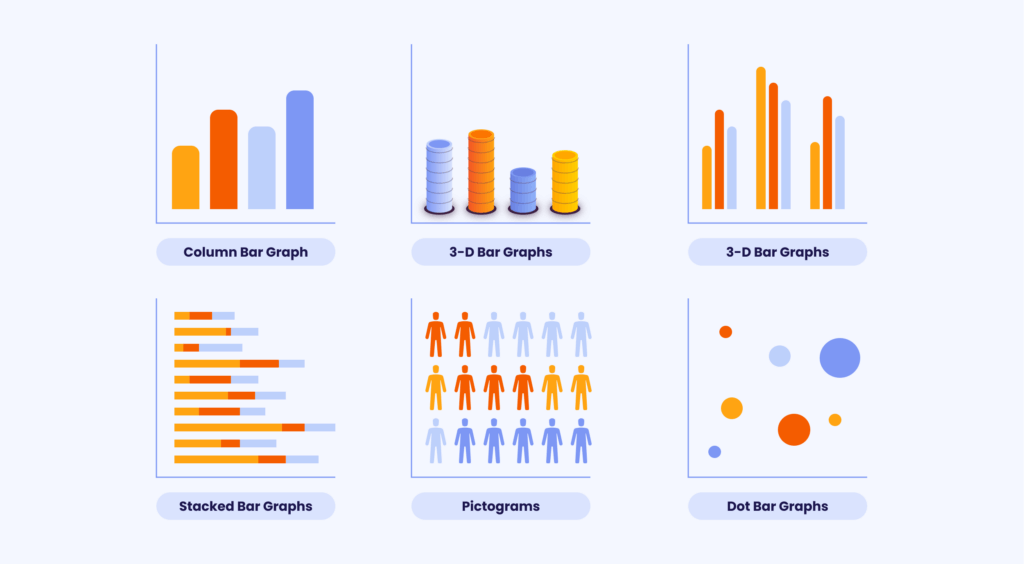
Visuals can help make your story that much more powerful. When you use charts, graphs and videos, this will likely retain your audience’s attention. You and I both know that nowadays everyone has a short attention span. So you would want to “wow” them while you have them. Here are few more exmples of data visualizations you can use:
- Pie Chart
- Bar Chart
- Histogram
- Heat Map
- Area Chart
- Scatter Plot
- Pictogram Chart
- Timeline
- Highlight Table
- Bullet Graph
What makes data storytelling so compelling?
Did you know that there is a biological factor that makes stories more compelling and memorable for human beings than just plain old facts? Basically, our brains prefer stories over pure data because brains take in so much information every day that they need to determine what’s important to process and remember and what can be discarded. When a person hears a story, multiple parts of their brains are engaged and activated. The part which controls language comprehension, plus the one which processes emotional response and the one which plays a role in helping us empathize with others. Since multiple parts of the brain will be activated, this makes the brain more likely to convert this into a long-term memory. Incredible, right?
So essentially, communicating your data insight through storytelling will make your insights:
- more memorable
- more engaging
- evoke deeper emotions
- more likely to be acted upon
The components of data storytelling

Before you can reap results from your data storytelling strategy, you need to know how to tell the most compelling story with your data. So, you have to know the components of data storytelling. Let’s look at them briefly:
know and cater to your audience
Just like we mentioned earlier, you will definitely need to communicate different messages to different people. So it’s important that you know your audience. What are their interests and goals? Knowing this will help you communicate in a way that ensures your audience gets what they want and you get what you want. Thus creating a win-win situation.
start with a question
Right from the beginning, you need to set up your story. What is it that your audience is going to learn?
provide context
If data insights are the foundation of your story the context is the scaffolding. Trying to tell a story without a context is like trying to build a house without scaffolding. The whole thing will fall apart. So give your story a context.

tell a compelling story
Take people through your journey by actually telling them a story that is based on narrative and not just facts and numbers.

be clear and concise
Have you ever listened to someone tell you a story that was full of tangents? You lose the message of their story because of all the unnecessary details they give. So be clear and concise in your data storytelling. Otherwise you’ll confuse your audience.

explain with visuals and narration
Visuals are powerful. Use them to help your audience understand the data (metrics, trends, and patterns) better. Explaining the visuals orally helps lend the story even more power.

be honest and credible
Remember we talked about ensuring that you tell a true story by using reliable data? That is absolutely paramount. Additionally, whatever negative data or trends your data reveals, you need to communicate with honesty. Don’t sugarcoat the negatives. And don’t mislead either.

end with an insight
Stories are beautiful but they are useless and ineffective if your audience does not learn something from it by the end. So make sure to end with an insight to make your story that much more compelling and help your audience take action straight-away.

Why Sports Organizations need a CDP to grow and thrive

Women in sports: beyond the hashtag – time to make a difference

Everything You Need to Know About NFTs in Sports
How can sports organizations harness the power of data storytelling to make higher revenue?

This part of the blog post will be a collaborative effort between you and I. You know your sports organization better than I do so while I give you the general idea of how you can use data storytelling to make higher revenue, you will also have to think outside the box so you can fill in the missing pieces. Think about all the situations in your organization that require to report something. Or communicate something. The list is almost endless because we talk to communicate something daily.
But think about all the different stakeholders that your organization needs to “convince” in order to get a specific action. For example:
- convincing fans to buy more tickets and/or merchandise
- trying to get fans to sign-up for newsletters and mailing lists
- getting a potential sponsorship partner to finally invest in your organization
- convincing governing bodies such as federations to help clubs with the cost of implementing solutions such as a CDP, that help clubs optimize their earning potential
- negotiating better partnership deals such as OTT partnerships
- trying to convince leagues to work with specific brands that align more with the values of your sport
- educating various stakeholder on new technologies such as blockchain, web 3.0 and NFTs.
The list is underless here. So take a few minutes to think about all the different messages you need to send out to get specific desired outcomes. Write them down and then continue with the blog post to get inspiration on how you can do this effectively.
Let’s look at a few of these examples.
Increasing fan engagement with data storytelling
You might read this and be tempted to think that only creative geniuses can do this. That it requires some over the top planning or something like that. But I am going to give you an example of data storytelling that you are probably familiar with. Although this example is not from a sports organization, it is a very simple story that is effective and can really drive fan engagement for your organization. This example, is none other than Spotify’s Wrapped. This is a campaign by Spotify that allows its users to view a compilation and summary of data about their activity on the platform over the past year. The campaign then invites the users to share this on social media.
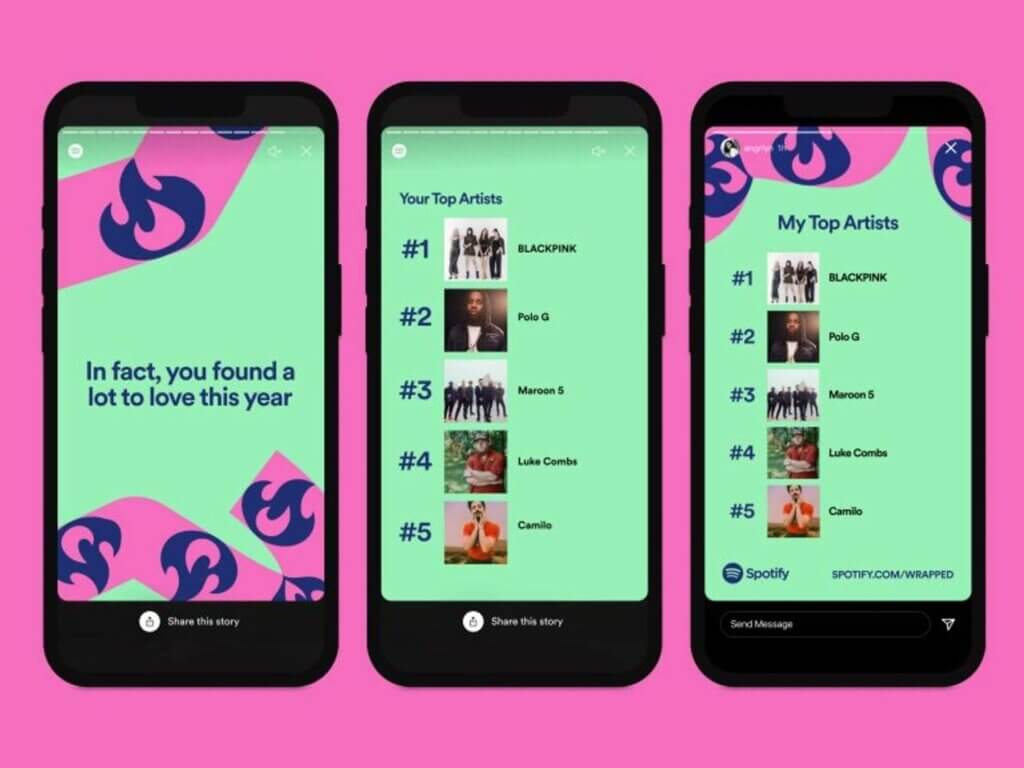
You can do the same thing with your sports organization. Look through your data. What exciting things are your fans doing when interacting with your organization? How about you turn this into an short and concise story and then ask your supporters to share this with their friends on social media.
You can start this campaign with your most loyal fans to show them that you see them and appreciate them. Or you can do this with your fans who rarely interact with you so you can reactivate them.
If you are wondering where you would get this data, once again the CDP is your best friend. So make sure you set yourself up for success by having a reliable source of data to fuel all your fan engagement strategies.
And what does fan engagement have to do with higher revenue? Well, the simple answer is the more engaged your fans are with your organization the higher your revenue is likely to be and vice versa. So investing in your fan engagement strategy is a surefire way of increasing revenue.
Boosting your sponsorship value through data storytelling
So you have identified a potential sponsor. This sponsor is perfect because your supporters have great affinity with the sponsor. You are very excited about this because the potential on the return-on-investment is phenomenal. Being the foward thinker you are, you understand the importance of data in proving your case. You compile all the necessary data. The numbers look fantastic and you are convinced that you will get the sponsorship. But hang on a minute. You remember that even though numbers are important, not everyone understands them. Not only that, but not everyone finds them engaging or interesting. So you have a dilemma on your hands. How can you effectively communicate the incredible ROI that both you and your sponsor can get if you partnered together?
And then you remember, through data storytelling!!

Using the components of data storytelling we discussed above, this is what you could do:
Example use case:
Since you know your audience is a potential sponsor, you will start there and cater to them. What might your potential sponsor want to know?
- Start with a question – your sponsor will definitely want to know what’s in it for them. So there’s your question.
- Provide a context – industry benchmarks based on research plus your own data can provide a strong context for your story.
- Tell a compelling story – here you can focus on how your supporters have strong brand affinity with the sponsor. Plus how they have previously engaged with your other sponsors, their web and purchasing behaviour for example.
- Be clear and concise – you might be tempted to tell your sponsor all about your supporters behaviour and why you are confident that they are the right sponsor. But remember to keep the scope of your story clear and concise. Information overload is never good.
- Explain with visuals and narrative – if you have a CDP for example, you can just export visuals from your dashboard to share with your potential sponsors. You can share charts on supporter lifetime value, bar charts on historic supporter purchasing behavior etc.
- Be honest and credible – instead of embellishing your story, tell the truth. With a CDP, you can then figure out a way to not let the negatives from the past repeat themselves. E.g. if a campaign didn’t go well previously, you can focus on retargeting using a CDP this time around. Your potential sponsors are more likely to trust you even more when you approach the negatives like this.
- End with an insight – after your incredible story, the question becomes so what? Something like, “we expect to see a 10-fold ROI so we ask that you invest X amount of money, for X length of time” is a good closer.
And this is my ending insight for you
You need to take advantage of the power of data storytelling in order to make higher revenue. The sooner the better. Telling a story is a powerful and effective way of communicating effectively. Not only that, but your audience is more likely to do what you ask of them if you tell them a good story. So your potential sponsors are likely to invest if you tell them a good story. And your fans are more likely to engage with you when they hear a compelling story. But here’s the catch. A story without data is just that – a mere story.
You need to ensure that your data is:
collected in one place
cleaned, unified and updated in real time
easy to share with other systems and the rest of the team
easy to read and work with
And this is where the CDP comes. It does all of this and more. So why not see how this looks in practice instead of just stopping at the theory?
