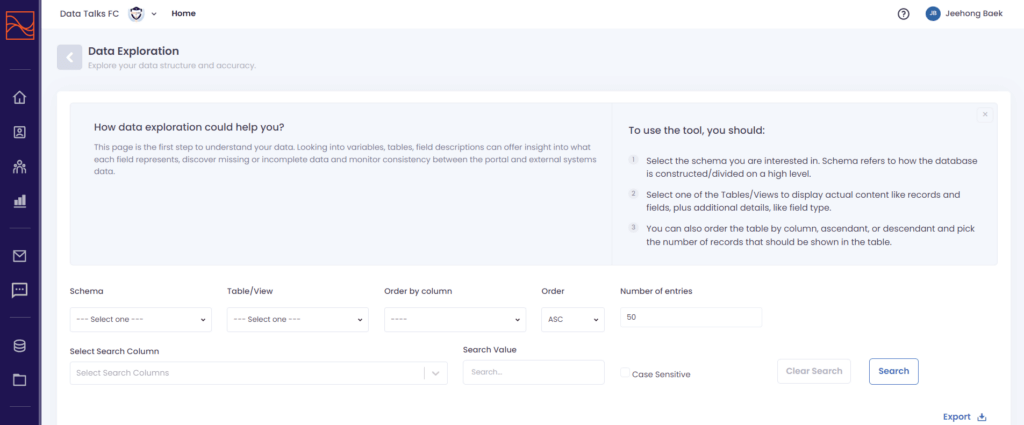
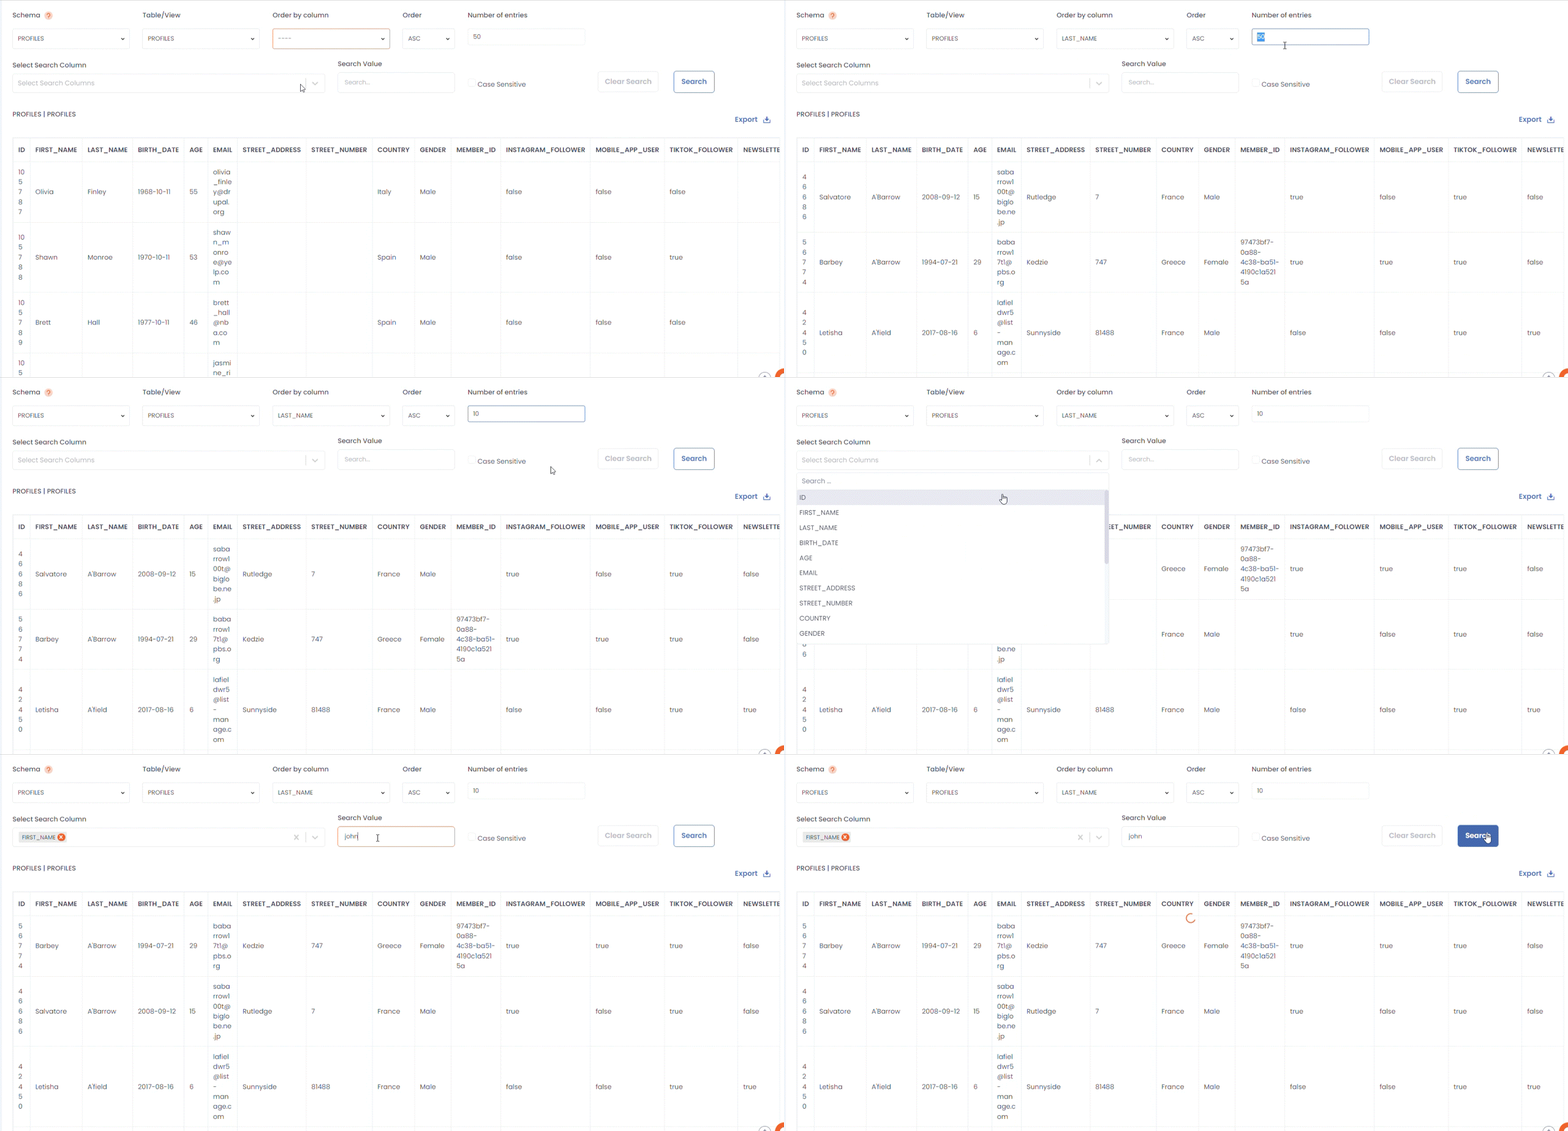
The Data Exploration page enables you to explore the raw data as it arrives from your source systems, such as your ticketing or merchandise systems. You can choose which data point you want to explore (e.g.: profiles, events or inventory), sort them, and search for a specific column. You are also able to export the data you find on this page as spreadsheets.
Through this feature, you are able to understand the data you are handling in the CDP much better and on a deeper level, which improves your user experience when using the Segment Builder and the Analytics Framework, as well as improving the accuracy of the data analysis results you can get from the CDP.
How it works #
You can find Data Exploration under the Admin section on the lower left side of the sidebar. In order to see the raw data, you first need to set conditions for what data you want to see.

Set the Conditions #
- Select the schema you are interested in. Schema refers to how the database is constructed/divided on a high level. For example, if you want to see the raw data about the profiles you are handling, then select the ‘Profiles’ schema in the drop-down list.
- Examples of schemas you can choose to explore the data in are: Profiles, Events, Inventory, Segmentation, Email Builder and Analytics Framework.
- Select one of the Tables/Views to display actual values like records and fields, plus additional details, such as field type. For example, if you choose the Profiles schema, you can see the lists of profile tables included in the Profiles schema in the drop-down list.
- You can then order the table by a specific column, ascending or descending. For example, you can sort out the table ordered by name, as ascendant, to see the profile names from A to Z. Another good example is to use a date-added column for sorting out the table in order to see if the database is up-to-date.
- Type the number of records you want to see in the table. The number is basically non-limited, but the speed to load records may vary depending on the number, so keep this in mind if you want to see a large number of records.
- You can also find a specific value with Select Search Column drop-down and Search Value blank.

Understand the Raw data #
Checking the raw data in the CDP helps you to understand what data is behind your segments and dashboards, and control the data set if you have any questions about the findings. The raw data table provided through Data Exploration offers you the opportunity to detect any existence of invalid data, data inaccuracy, and inconsistency.
Use Case: What if you created a segment for your top 100 spenders in terms of ticketing and launch a campaign, and one of your supporters reached out asking why they are not among them? The Data Exploration is able to offer you insights about the reason why. Here is how you can do it:
- Go to the Data Exploration page and set a related segmentation schema and table as search conditions.
- Then, find the column which is related to the segment rule attribute, in this case, ticket spending.
- Explore the values of the column and order them according to the amount of ticket spending and set the number of records to 100. Imagine that in the search result, you find the info of the customer who reached out to you for a complaint. You are able to know that segmentation is not working perfectly. If you cannot find it, still, you know the answer to the question. It is just because the customer did not spend that much.
Now, your next step is to reach out to your CSM to fix the problem of segmentation or reply to the customer with the explanation and probably, additional promotion deal offer.
Export the Raw data #
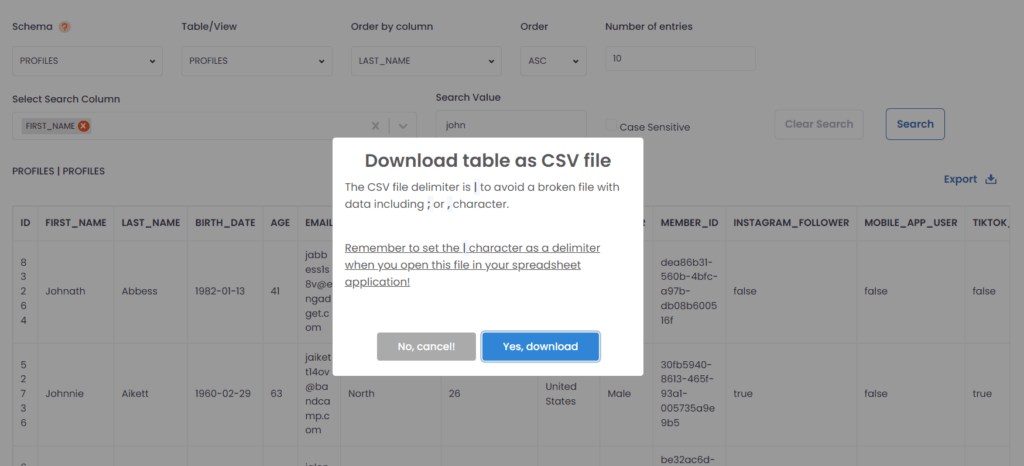
Your data in the CDP can come both from your own sources and from the other integrated systems. In some cases, you have the original files, but in other cases, you don’t. We want to cover all the cases in preparation for your need for the data files. That is why data exploration allows you not only to see the raw data but also to export the data as files, regardless of the data source. You are able to export any data from the data exploration page as long as you set the appropriate conditions so that you can see the right table on the page. The table you see in the Data Exploration is exported as it is, in the form of a CSV or Excel spreadsheet. Just find the Export button on the upper right side and click on it. Then the pop-up to choose the option for whether it will be CSV or Excel spreadsheet will show up.
NOTE: The CSV file you get uses | (pipe character) as the default delimiter (see image below). This is in order to avoid the risk of broken CSV files as much as possible. If the data you are trying to export includes a comma in their values, the way to delimit the file with a comma breaks the exported CSV file, and the same goes for other characters as well. We could find several cases in which our customers’ data include commas, and see that the pipe character is rarely used in the dataset, so it is chosen to decrease the risk to the minimum.

However, it still means that your file can be broken if your data includes a pipe character. So if you are not certain whether your file includes a pipe character or any special characters which can occur the file broken such as emoji, “, and ‘ then please select the Excel spreadsheet, as the safer choice.